Exercise: Parametric facade (1/4)
In the last exercise, we designed our building floors as curved ellipses, which was relatively easy to do with one component in Grasshopper. In reality, though, most building materials come in flat sheets, which are easier to manufacture and cheaper to transport. Considering the scale of the building, describing the facade as a series of flat panels that follow the outline of the ellipses would probably achieve a very similar effect, though at a much lower cost.
In architectural design, the process of refining a model’s geometry so that it takes into account the constraints of the material and process used to build it is called rationalization. In this exercise, we will rationalize our simple curved facade by describing it as a series of flat rectangular panels.
Step 1: Design concept and strategy
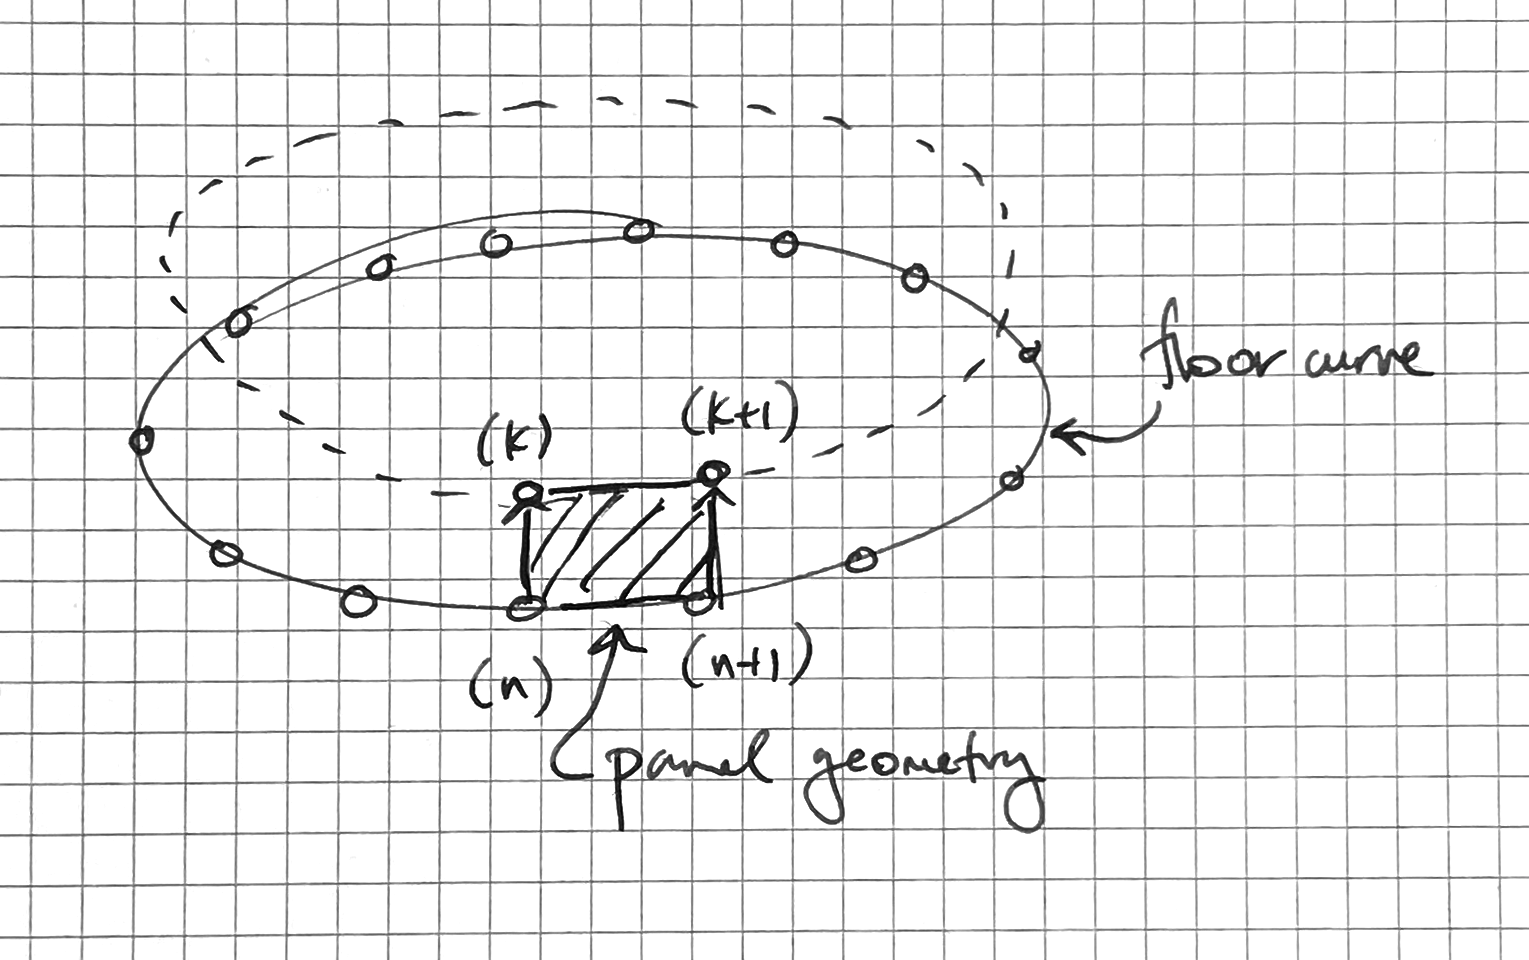
Our goal in this exercise is to create a set of rectangular, flat panels as individual surfaces that approximate the elliptical floor plates as much as possible. To define each rectangular surface, I need four points that define its corners. To make sure the panels follow the ellipse I can place these points on the floor profile curves at regular intervals. This will give me a set of points defining the lower edge of each panel. I can then move the set of points up to define the upper set of points. I then need to create a computational strategy for going through these sets of points, choosing the right set of 4 points each time to create each panel.
Step 2: Make some points
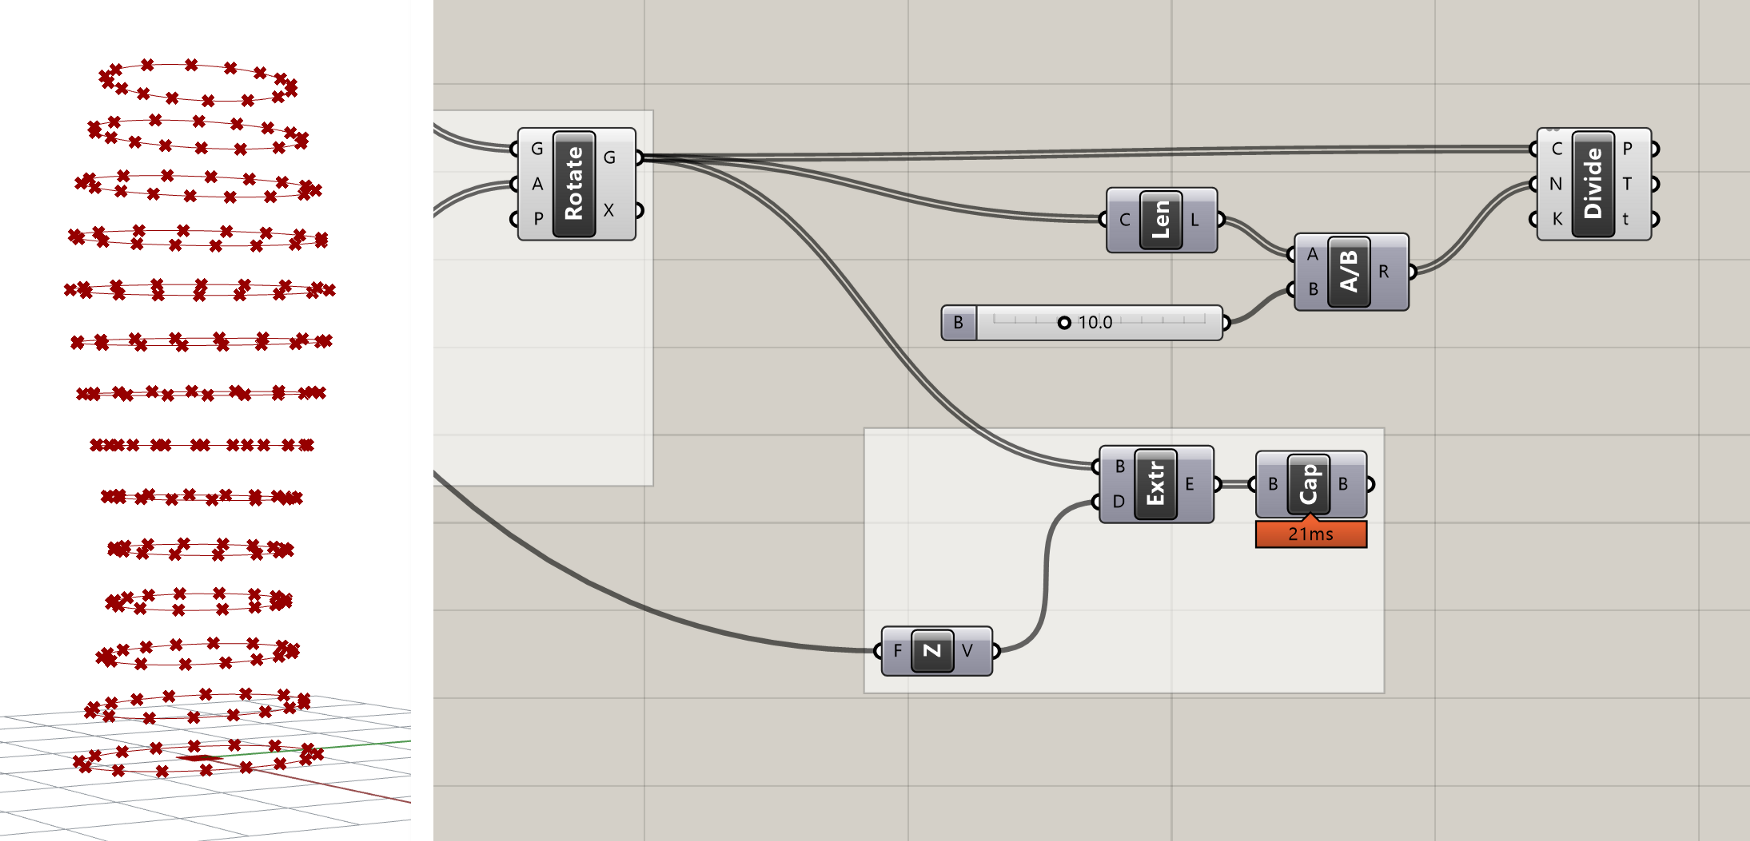
To create the points, we will use the Divide Curve component, which we already saw in the first exercise. Let’s create a new Divide Curve component and connect its (C) input to the Rotate component’s (G) output which is storing all the curves representing the floor outlines. By default, this will create 10 points evenly distributed on each floor curve, but we can control the number of points created by connecting a number into the Divide Curve component’s (N) input.

Let’s say, however, that we don’t know how many panels each floor needs. Instead, we may want to specify the maximum size of any panel. We can build this into our definition by first using a Curve Length component to find the length of each curve, and then dividing that length by the maximum width we want for the panels (I’ll use 10'-0"). This division will give us the number of panels (and thus the number of curve divisions) we need to make sure our panel ends up the proper width.

Because the length of the curves will not necessarily be evenly divisible by the target width of the panel, the division will most likely produce a decimal number. If you plug this number directly into the ’N’ input of the Divide Curve component, the component will automatically round to the nearest integer. However, depending on whether we round up or down, the final panel width may end up being slightly smaller or slightly larger than the target. To ensure that our panels are always no wider than 10'-0", we need to force the division to round up. We can do this with the Round component, which takes a decimal number and gives us three options for how to round it — Nearest, Floor (force round down), and Ceiling (force round up).
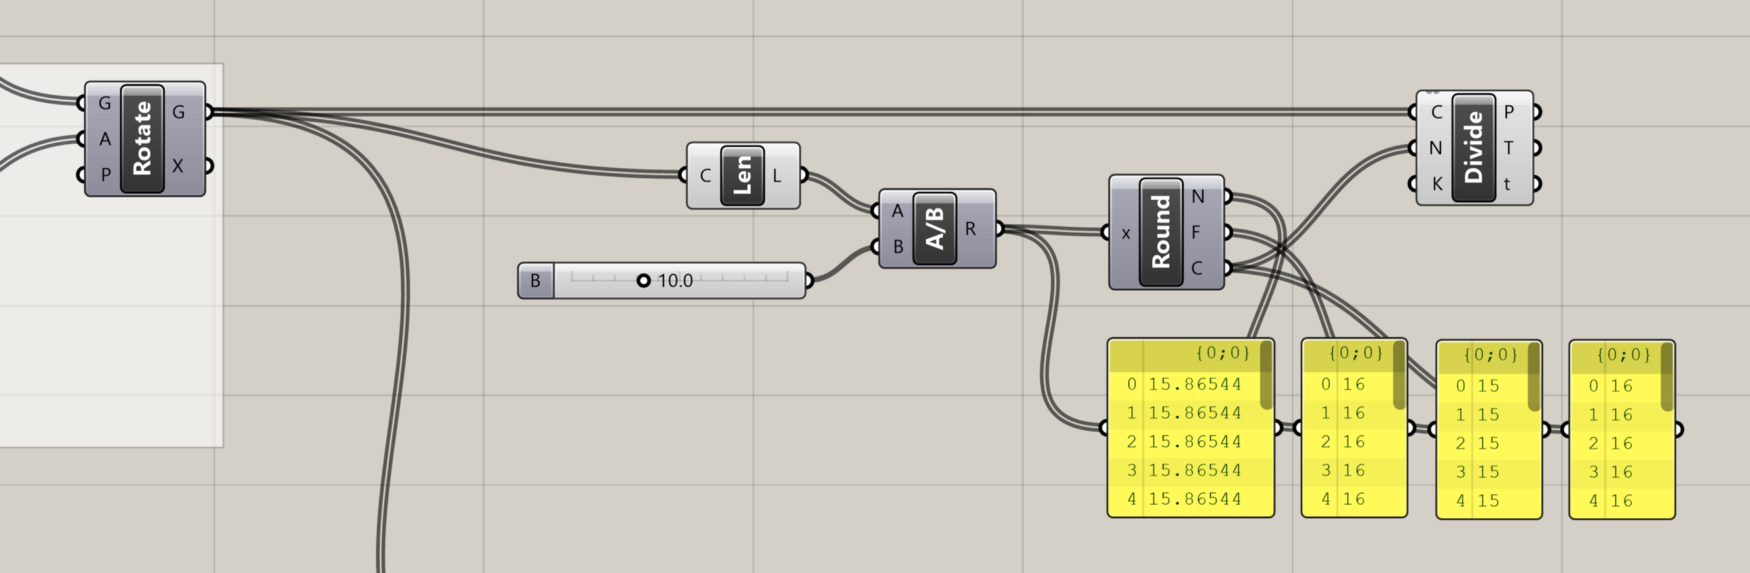
Comparing the three outputs of the Round component
If you hover over the ‘P’ output of the Divide Curve component, you will see that the data is organized as a DataTree (we reviewed Data Trees in the last lesson). Instead of listing the actual data, the tooltip now lists the path and number of items in each branch of the DataTree. In this case, we have 14 branches in the DataTree (one for each floor of our building), with 16 points in each branch representing the 16 points generated by dividing each curve.
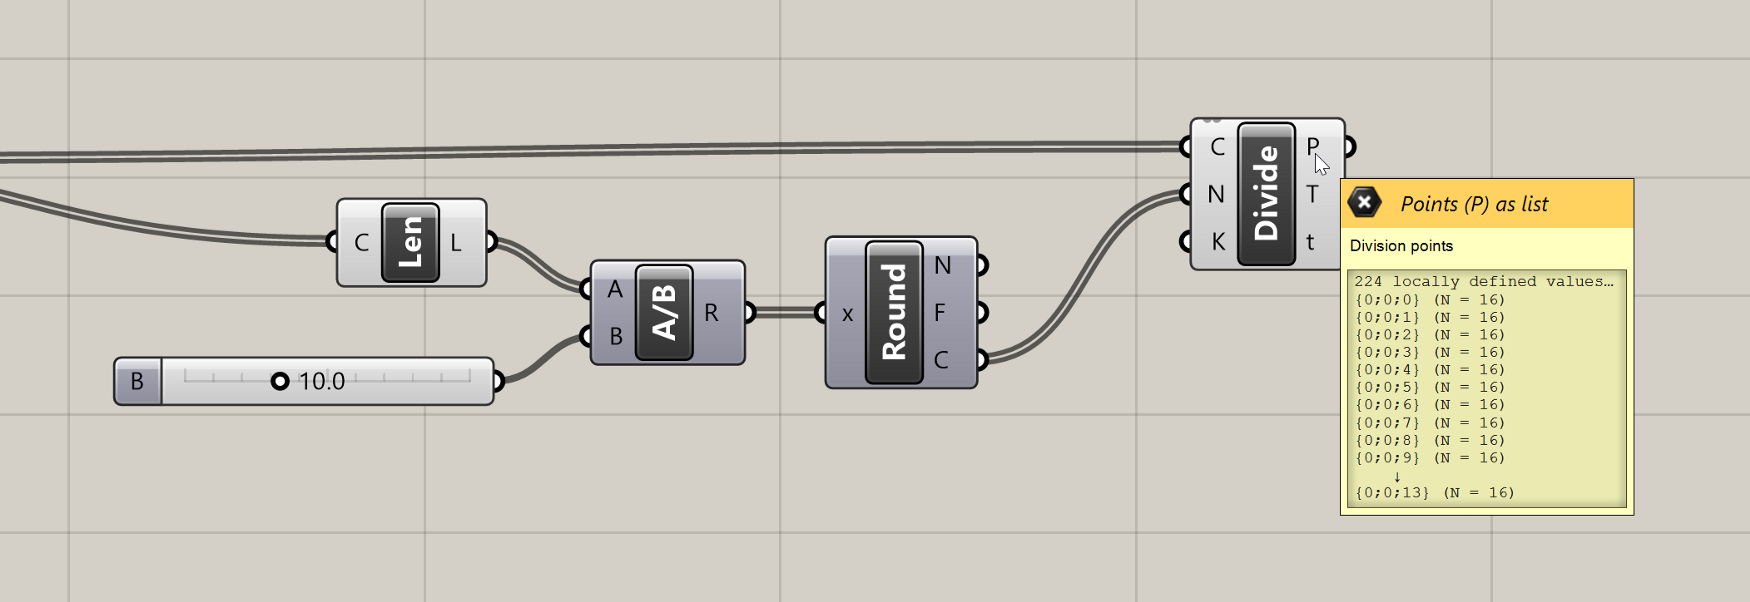
Tooltip showing the structure of the DataTree produced by the Divide Curve component
The DataTree was created automatically by Grasshopper because we supplied a List of Curves to the Divide Curve component which itself produces a List of Points for each Curve. The Divide Curve component runs once for each Curve and puts the resulting Points on a separate branch of the DataTree. Although DataTrees can be confusing at first, they are actually quite helpful for organizing data in proper hierarchies based on how the model is built. Without DataTrees, we would be stuck with one long list of Points after our division, which would make the rest of this exercise much more challenging.
NOTE
It would be challenging but not impossible, and in fact before DataTrees were implemented in Grasshopper there were many workarounds for doing this using clever data manipulations. As an extra challenge, try flattening the set of points coming out of the
Divide Curvecomponent, and see if you can work through the rest of the definition while still generating the proper final output.
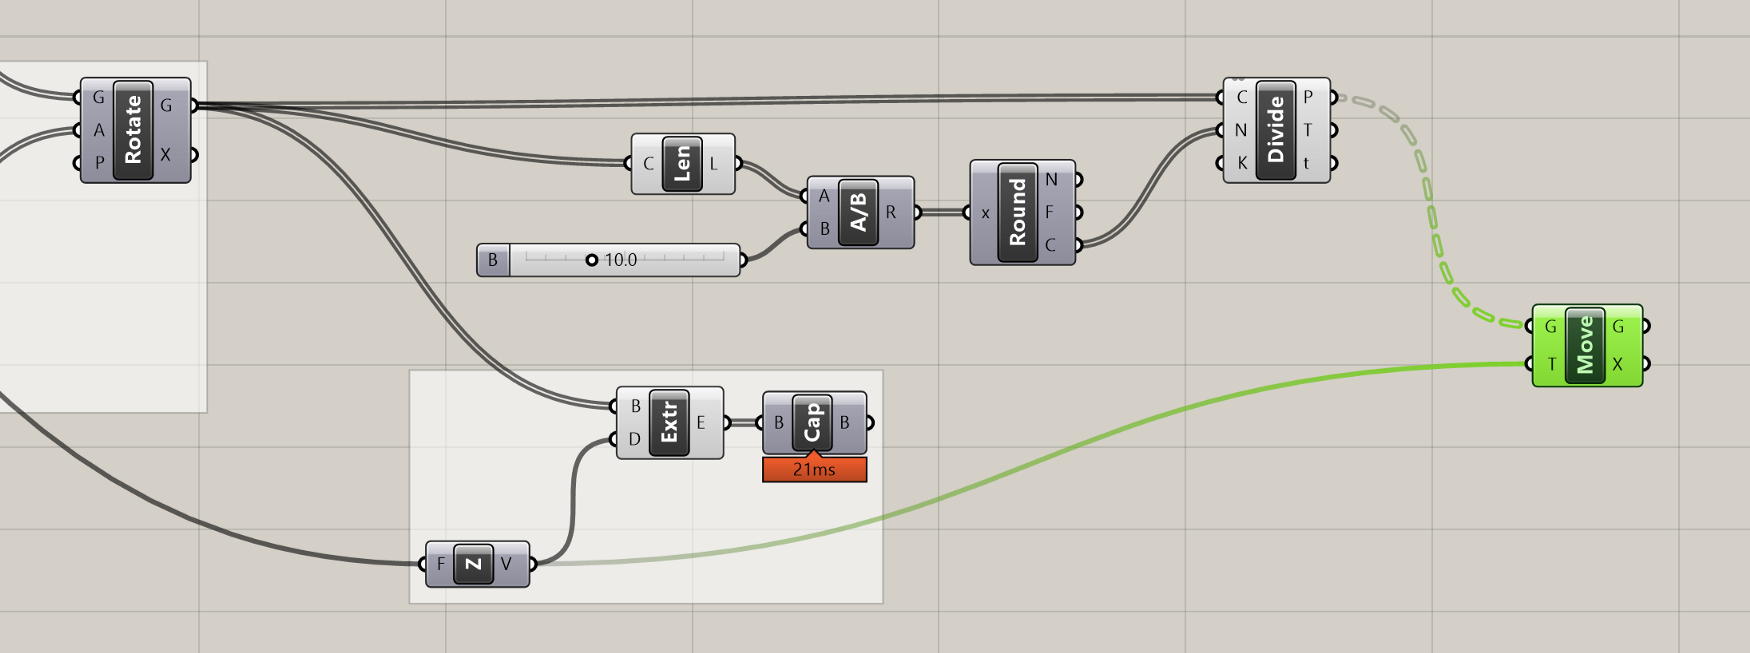
The points generated by the Divide Curve component will define the lower two corner points of each panel. To define the upper corner points we can use a Move component to create another version of the Points moved up to the top of each floor. We can reuse the Unit Z component we created previously for the extrusion to specify the translation vector of the move.