Working with data (1/4)
Creating lists
Many components generate Lists of items as a result of their operation. For example, the Divide Curve component we saw in the first exercise uses one curve and a value specifying the number of divisions to create a List of Points along the Curve.

To create your own List from scratch, you can input multiple values into a Panel component. A shortcut for creating a Panel is to double-click on the canvas to bring up the search bar, then type ‘//’. This will create a new Panel, and place any text you type after the two slashes into the Panel. A Panel can be used to input text or numerical data. To create a List of values, put them on separate lines in the Panel. Make sure to right-click on the Panel and select the option for ‘Multiline Data’ to separate the lines into different items in a list. Otherwise, the text will be output as one big chunk.
You can find many useful components for creating and manipulating Lists in the ‘Sets’ tab in Grasshopper’s component toolbar.
The ‘Sets’ tab of the component toolbar contains many useful tools for working with Lists
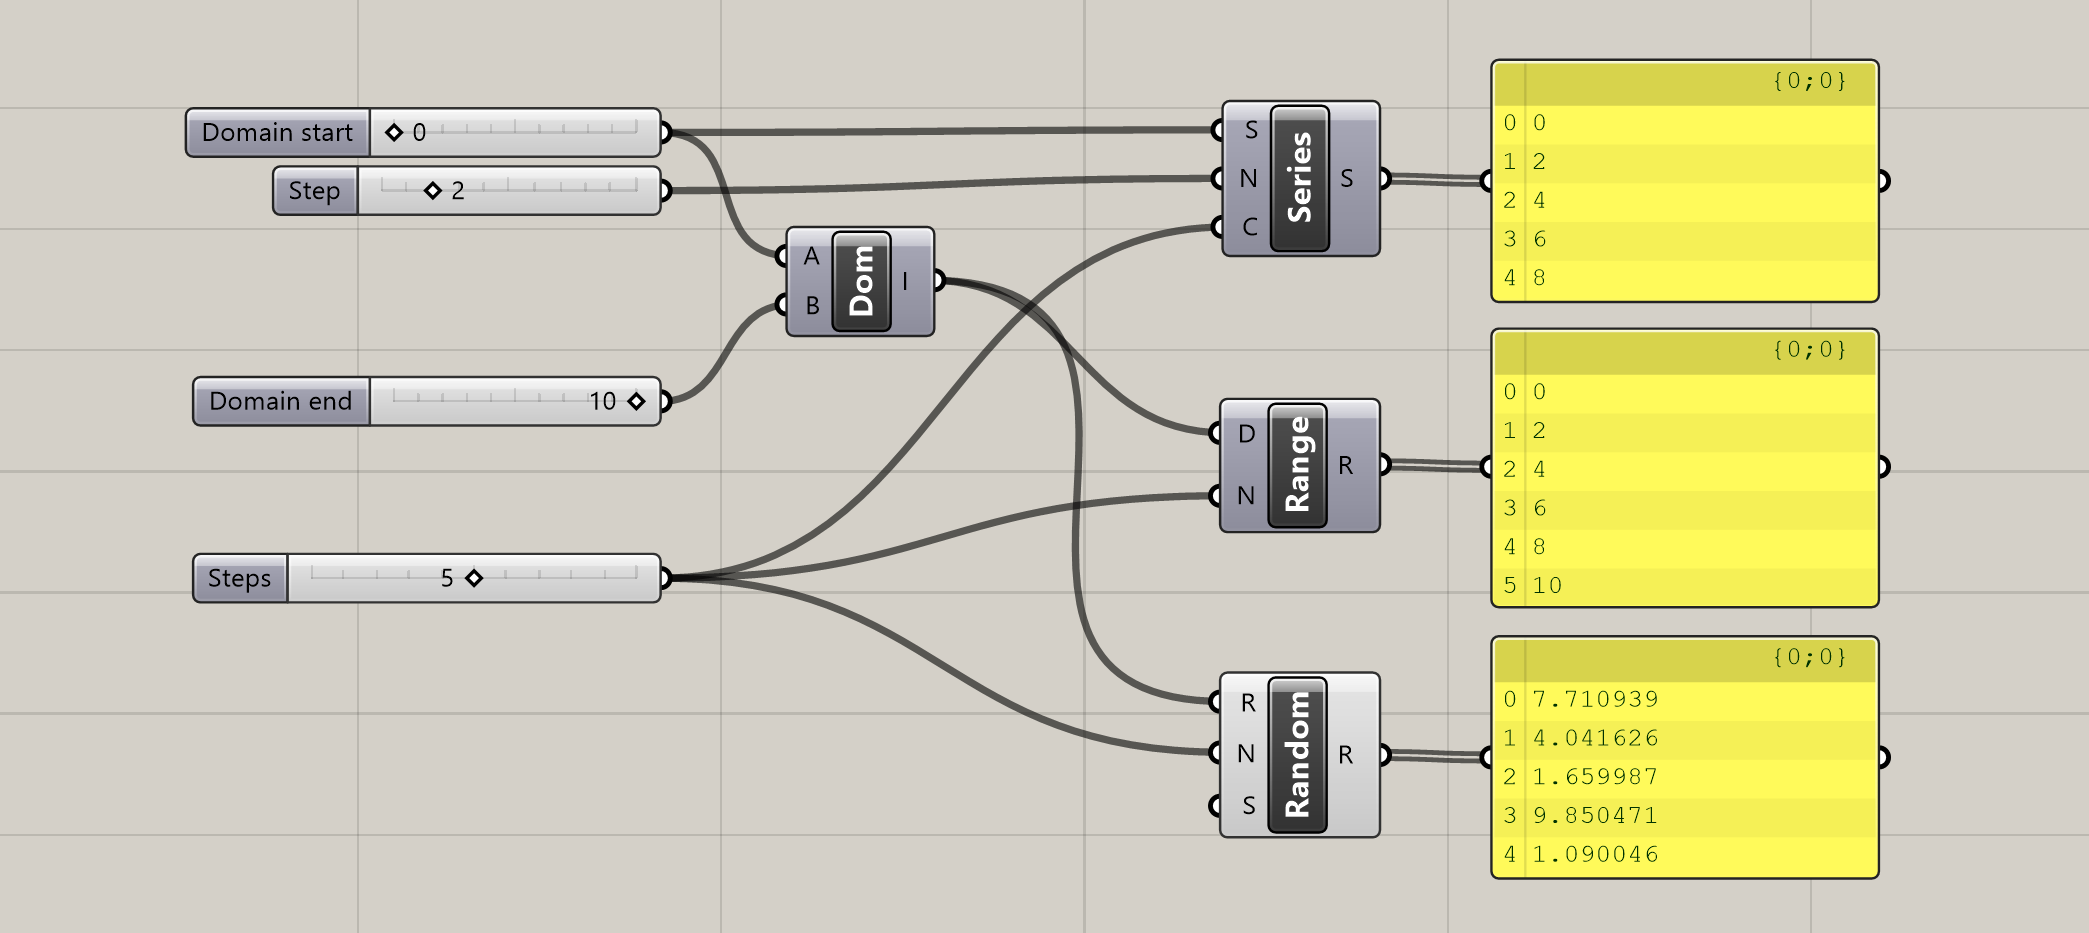
In the ‘Sequence’ section of the ‘Sets’ tab, you will find several components for generating sets of numbers, which can be very useful for driving your computational models. In the previous exercise we used the Series component to generate a set of numbers given a starting value, a step value between each number, and a total number of values to generate.

The Range component also generates a set of evenly spaced numbers, but it does so based on a Domain that defines the minimum and maximum value, and the total number of values to generate within that range.

The Random component will also generate a set of values within a given Domain, but it will choose the values randomly. To create different sets of random values, you can input different numbers into the Seed (S) input, which controls how the random algorithm is run. While the numbers created by the Random component will always appear random, inputting the same Seed will always produce the same set of numbers. This is important for making sure that the numbers don’t change each time you re-run the script.
Seeing the data
A quick way to see the data stored inside a component is to hover over any of the component’s input or output ports. A tooltip will pop up with a preview of the data stored inside the port. You can also pass the data into the input port of a Panel component, which will display the data in a scrollable table. This is a great way to monitor the data being produced by your definition and keep it visible on the canvas.
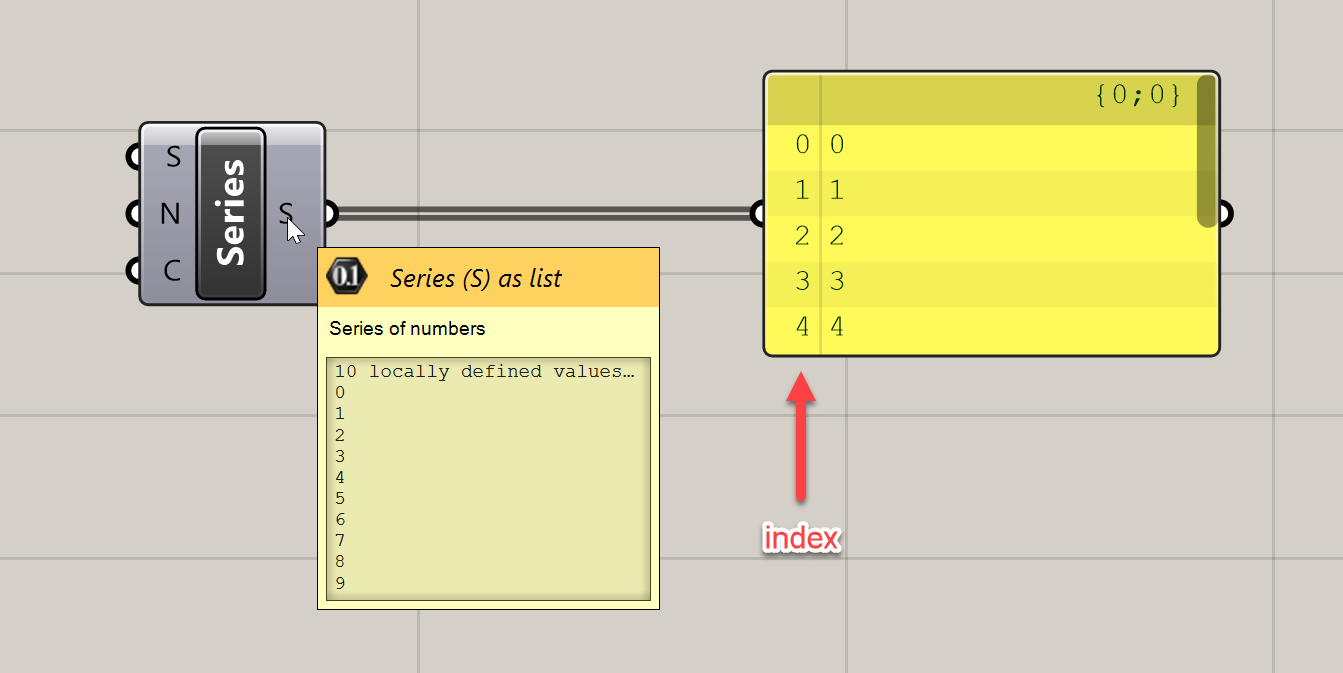
In the table generated within the Panel, you will notice that each value in the List has a corresponding number to the left of it. This is the index of the item, and it represents the item’s position in the list. You will also notice that the first item’s index is 0, not 1 as you might expect. This is because in Grasshopper, as in most programming languages, elements are numbered starting with 0. This can take some getting used to but you will get the hang of it over time.