Working with data (4/4)
How DataTrees affect the data flow
Earlier, we saw how inputting a List of data into a component that expects a single item causes the component to run multiple times, producing multiple outputs as a result. When you input two Lists into a component, the component will run as many times as it needs to process every item in both Lists, reusing items from the smaller Lists as necessary. When you input multiple DataTrees into a component, this same process is extended to the branches of the DataTrees.
The component will first match branches between the trees, and then for each pair of branches it will work through all the elements in both branches the same as it would for multiple Lists. If one DataTree has more branches than another, the last branch from the smaller DataTree is reused as necessary until all the data has been processed.
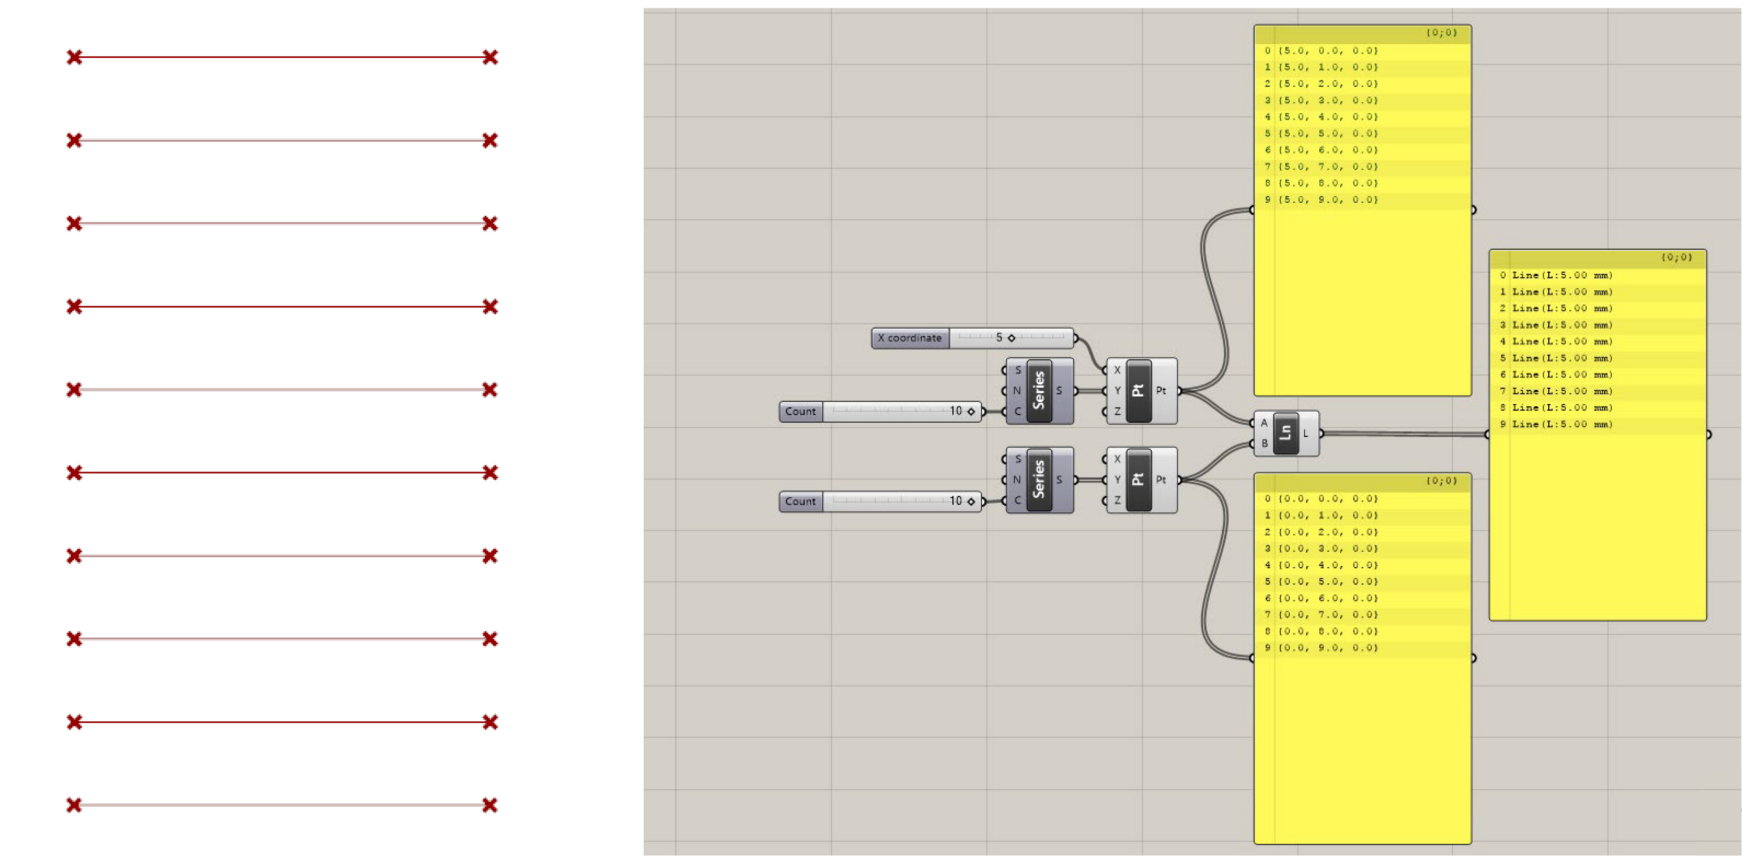
Let’s look back at the previous example where we were connecting multiple lines using two lists of points. We saw that inputting two lists of ten points created ten lines, one line using each pair of points from both lists. But what if we wanted to generate 100 lines, with a line connecting each start point to each end point?
This is where DataTrees come in. To get each start point to be processed using each end point, we can use the Graft component (or filter) to convert one of the inputs from a List of ten points to a DataTree with ten branches, one point on each branch.
When the Line component gets the List and DataTree as inputs, it will first match the branches in each data set. In Grasshopper, DataTrees are not a separate concept from Lists, but an extension that allow you to work with multiple Lists within the same dataset. In fact, a List in Grasshopper is actually just a DataTree with a single branch. You will notice that when you view a List in a Panel, there is still a branch index at the top of the list with the default path {0;0}.
Thus, when the Line component is matching branches between the List and DataTree, it will use the same single branch of ten points to compare to each branch in the DataTree. The ten points in the List will be used to generate ten lines for the single point in each of the ten branches of the DataTree. The result is a DataTree containing ten branches, with ten lines on each branch, or 100 lines total.
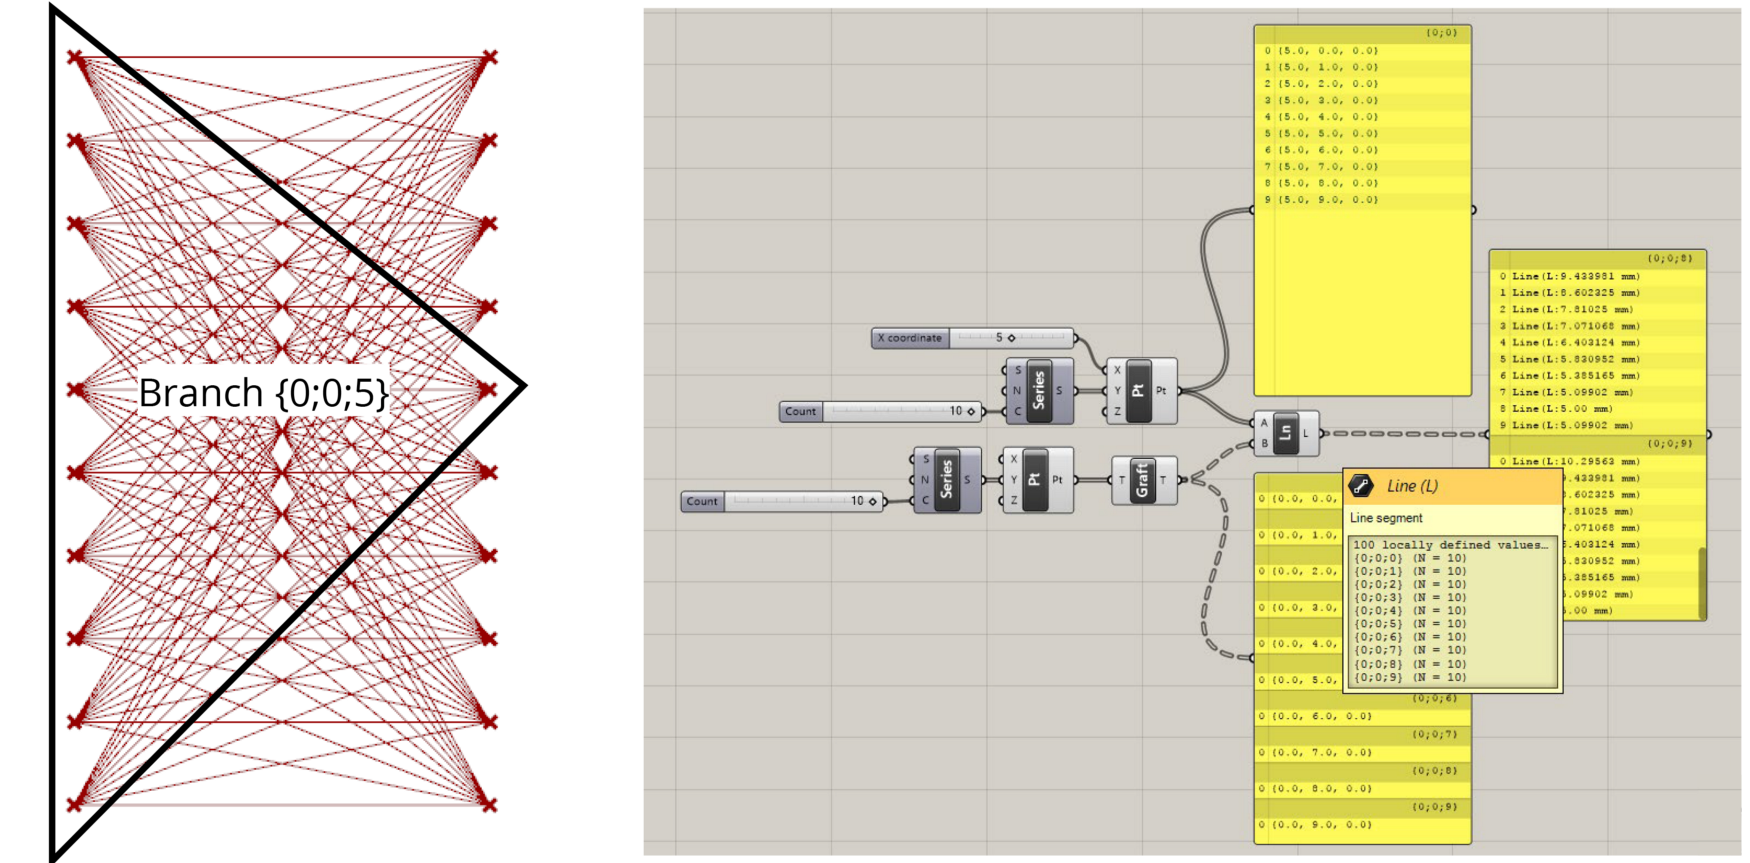
Grafting a List to compare each element in one list to every element in another
Conclusion
Managing DataTrees and using their structure to control how components function can be one of the hardest challenges when you’re first learning Grasshopper. Because Grasshopper does not allow us to write explicit instructions for how the components should run, often the only way to get a component to do what you want it to do is to first structure the data you pass into it the right way. As we saw with the previous example, the same ten points passed through the same component can produce very different results depending on how those ten points are organized in the data.
Learning how to work with DataTrees effectively will take time, and like most things Grasshopper, the best way to learn is by doing. In the next exercise, we will continue with the Parametric Tower tutorial, and see how we can use Lists and DataTrees to organize our data effectively as we start to add detail and features to the model.