Working with data (3/4)
Working with DataTrees
In Grasshopper, DataTrees are used to organize data in more complex structures than a single ordered List. An easy way to think of DataTrees is as a collection of Lists. If a List is a structure for organizing two or more items of data, a DataTree is a structure for organizing two or more Lists.
Each List in a DataTree is called a branch. Just as every item in a List has an index that specifies its position in the List, each branch in a DataTree has a path that specifies its location in the DataTree. Thus, any item in a DataTree can be retrieved by specifying the path of the branch the item is on, followed by the index of the item in that branch.
DataTrees use a hierarchical structure to organize their branches, which is reflected in the structure of its branch paths. For example, let’s take a DataTree composed of four branches. In one case the DataTree might have one level of hierarchy with each branch organized on the same level. In this case, each branch would have a path composed of a single number to specify its position on that level. In another case, we might want to organize the branches in two levels of hierarchy with two groups of two branches. In this case, the branches would have paths composed of two numbers, each number specifying the position of the branch at each level of the hierarchy.
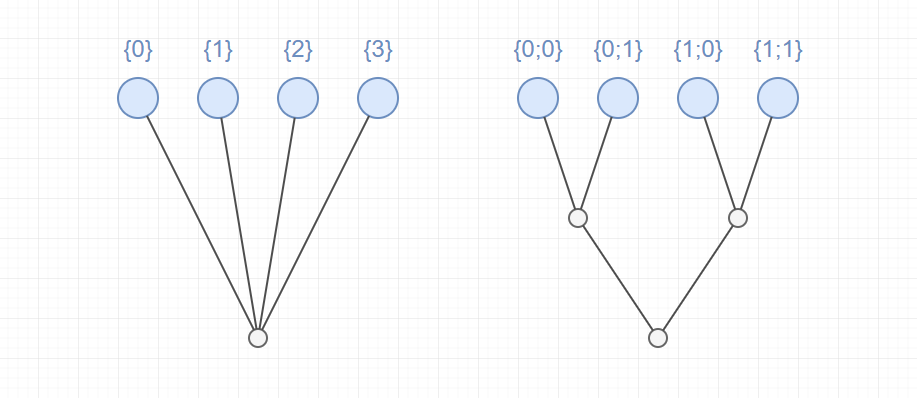
Example of two DataTrees with different hierarchies for organizing four branches
DataTrees are often created when a component that produces a List of data from a single input value is supplied a List of input values. For example, the Divide Curve component we saw in the first exercise takes a single Curve and produces a List of Points as a result. If we input a List of Curves instead, the result will be a DataTree, with the List of Points resulting from dividing each Curve represented as individual branches in the tree. The heirarchy of branches in a DataTree often reflects the history of how the data was produced as it was passed between different components in the definition.
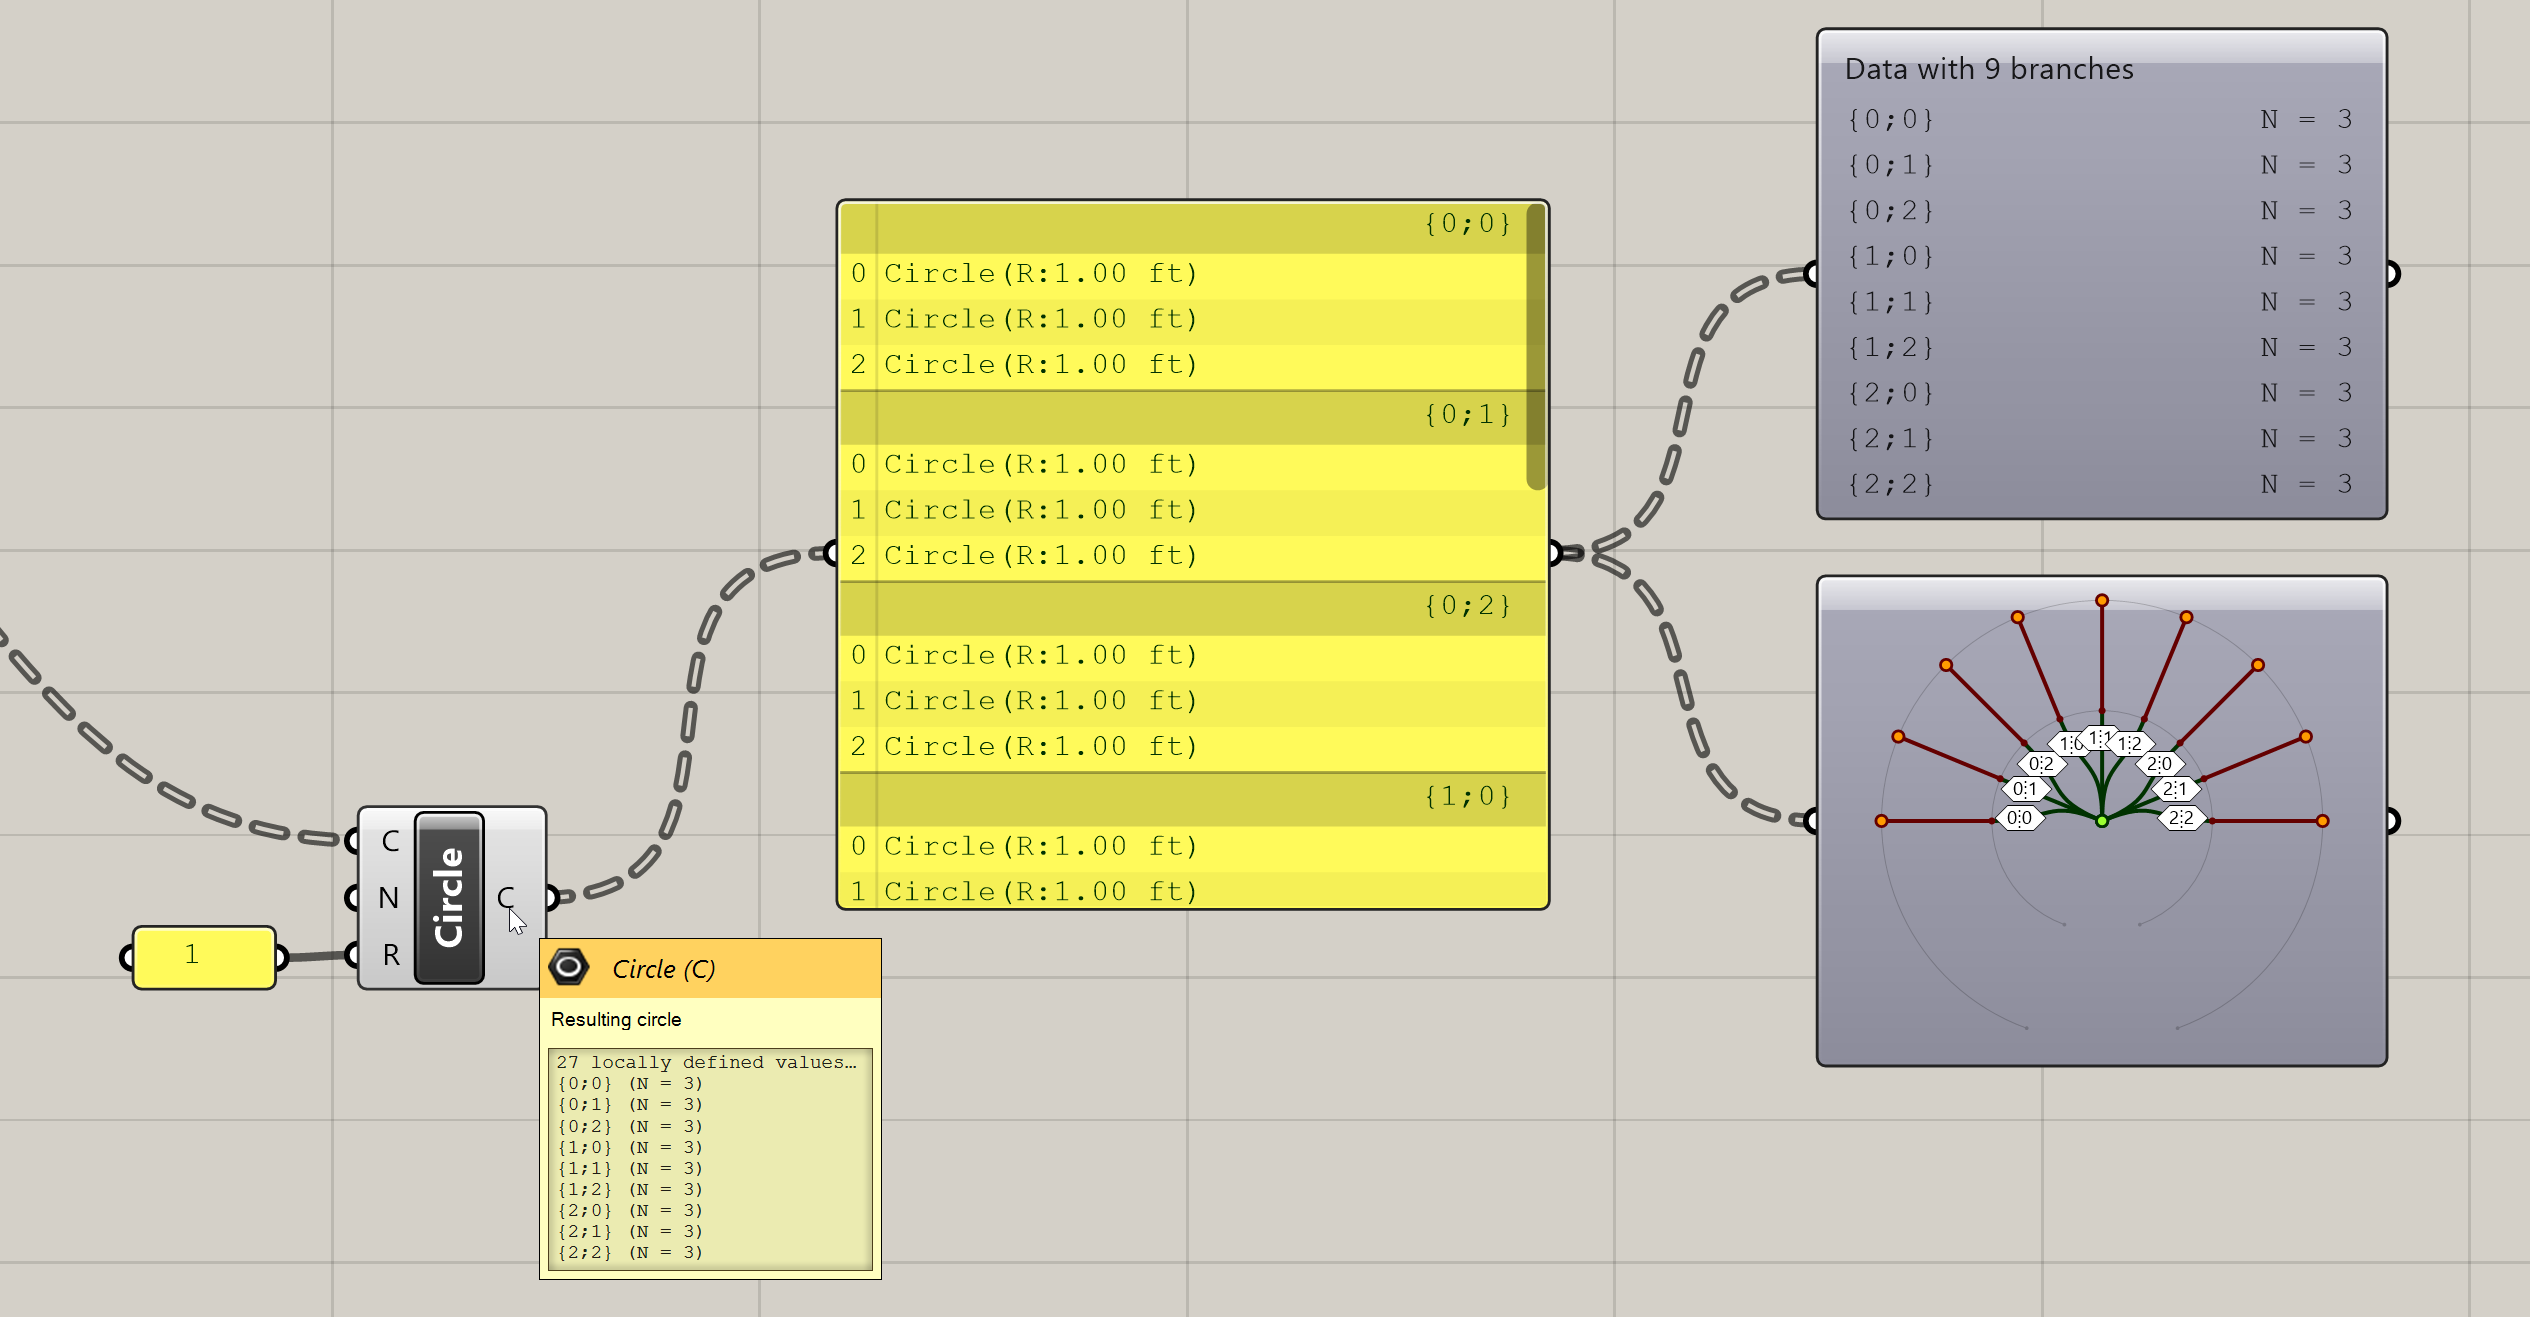
Extending the first exercise to create a DataTree of circles organized hierarchically into branches
Visualizing DataTrees
When you first start working with DataTrees, it can be difficult to keep track of the structure of the data being produced. Often it helps to visualize the data to understand not only what it is but how it’s structured into branches and the hierarchy of that structure.
There are three basic ways to visualize the structure of a DataTree. The first two we’ve already seen above:
Hovering over any input or output port will give you a tooltip with a preview of the data. If that data is in a DataTree format, however, you will not see the actual data items but a list of the branches with their paths and the number of items in each branch.
You can also pass the data into a Panel component, which will show each element in the DataTree organized by branch. Each branch is denoted by a dark bar with the path of that branch in it.

Finally, there is also a special component for visualizing the branch structure and hierarchy of a DataTree called Param Viewer. This component has two modes for visualizing DataTrees which you can switch between by double-clicking on the component.
The first mode will list the branches in a DataTree, showing the path of each branch and the number of elements in each (this is similar to the tooltip display you get from hovering over an input or output port). The second mode gives you a visual representation of the DataTree showing the levels of hierarchy and path of each branch.
Working with DataTrees
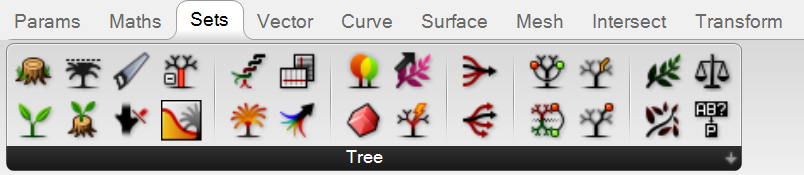
The ‘Tree’ section of the ‘Sets’ tab in the component toolbar has many useful components for working with DataTrees.
Flatten Tree— removes all branch hierarchy and moves all elements to a single branch. In effect, it converts a DataTree into a List.Graft Tree— adds a level of hierarchy to a DataTree by placing all the items in every branch onto their own branches. Passing a List into aGraft Treecomponent creates a DataTree with a separate branch for each item in the List.Simplify Tree— simplifies the DataTree as much as possible by removing unnecessary levels of hierarchy. This can be useful for cleaning up overly complex DataTree structures that may have been created as the data was passed through multiple components.Explode Tree— breaks the branches of a DataTree into individual Lists represented by individual outputs in the component. This component has a zoomable UI which you can use to add outputs and specify the branch path the output should pull data from. To automatically match the outputs to the structure of the DataTree you can right-click on the component and select ‘Match outputs’ from the context menu.
Using the Explore Tree component to separate DataTree branches into individual Lists
Flip Matrix— for DataTrees with only one level of hierarchy (all branches organized on the same level), this component flips the relationship between the paths of each branch and the index of the items in each branch. For example, if you input a DataTree composed of five branches with ten items in each branch, theFlip Matrixcomponent would produce the same exact data but now organized as ten branches with five items in each branch. The first items of each branch would go into the first branch, the second items of each branch would go into the second branch, and so on. This is similar to transposing a table by flipping the rows and columns.Path mapper— allows you to change the structure of a DataTree by indicating the starting and ending path hierarchy. Right-clicking on the component will display a context menu where you can select from several common mapping types. A very useful one is “Trim Mapping” which trims the furthest branches of a tree by combining elements with the same path one level below on a single branch. A good way to get familiar with what thePath Mappercomponent can do is to start with one of the presets and then double-click on the component to experiment with editing the mapping further.
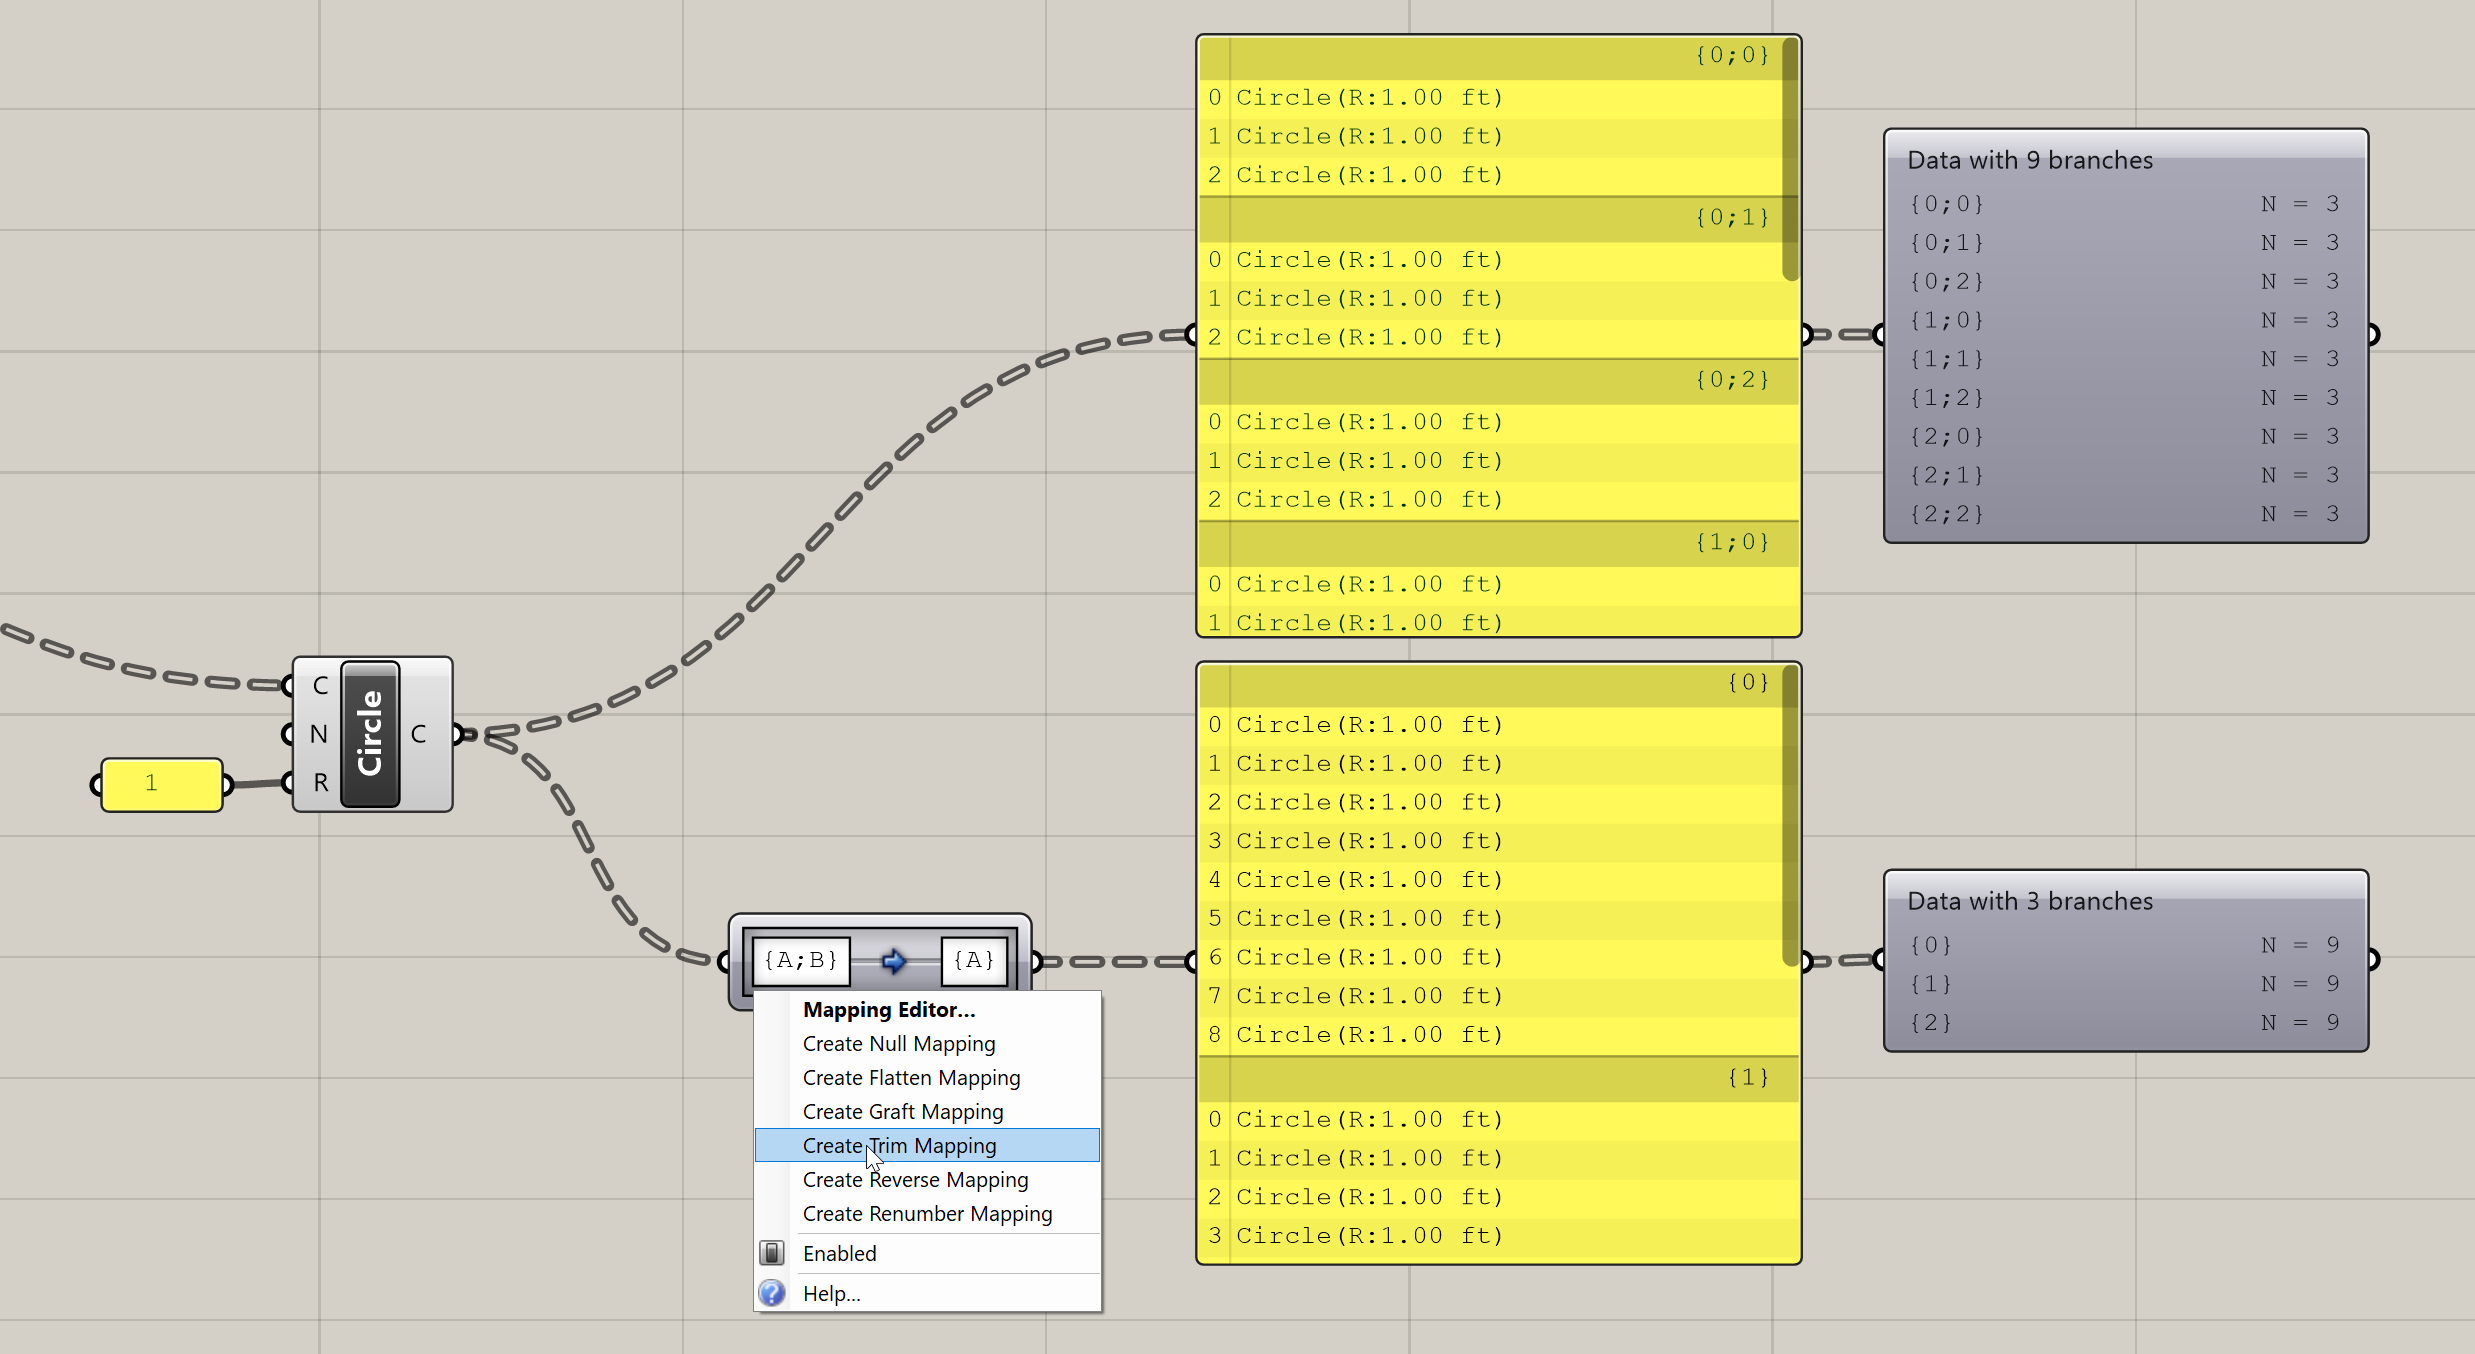
Using the Path Mapper component to trim the branches of a tree
Some of the most common data manipulations such as Flattening and Grafting a DataTree or reversing the order of a List can be applied as a filter directly to data as it enters or leaves a component. To apply a filter, right-click on a component’s input or output port and select it from the context menu. This is also a quick way to experiment with different data manipulations if you are trying to get your data to fit what a certain component needs.
Applying filters to modify the structure of a DataTree in a component’s output